Migration 2013 to Continents and Countries. Poland in the Lead. The Turks Are Closing the Queue.
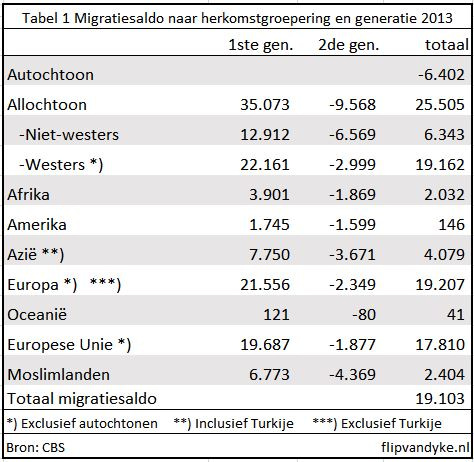
Net immigration of immigrants (first and second generation) was 25,505 in 2013. Poles accounted for more than a third of this balance and the Turks explained that the balance had decreased.
Net immigration from Poland in 2013 was higher than that of all 47 Muslim countries combined.
This article provides an overview of the net number of immigrant immigrants. The large groups of origin as well as the continents, but also the first and second generations.
Figure 1 shows the main groups of origin and the continents from which they come. In my last article, I discussed net aboriginal immigration and the totals of the second western and non-Western generations. On a net basis, 35,073 first-generation immigrants were added as a result of migration. More than a third (12,912) were non-Western and 22,161 were Western. It makes sense that more second generations leave our country than there will be, because this generation was by definition born in the Netherlands. The negative net migration of this group is -9,568, to which more than two-thirds contributed to the second non-Western generation.
Western immigrants contributed three-quarters (19,162) to the total (positive) balance of 25,505 immigrants.
First-generation net immigration from Africa was 3,901. I have written several articles on migration from Africa and what some personalities (Scheffer, Bolkestein) and charlatan Niem-ller have written about it so that I can suffice with the observation that there is still no tsunami and that the preliminary figures for this year are not either. show, although there is an increase (Eritreans). A net 1,869 second-generation immigrants left, resulting in 2,032 as the final result.
Lion’s share (21,556, 60%) first generation of net immigration comes from Europe, of which more than 90% (19,687) come from the EU.
The 47 Muslim countries have 6,773 more first-generation immigrants and second-generation emigration was 4,369 higher than immigration. The result is a net migration of 2,404. The balance was still negative in 2012 and is expected to rise sharply this year (Syria).
Countries
I looked at the top 10 countries of most of the first, second generation and total net immigrants. In the second generation, most entries.
Table 2 is sorted by first generation
Of  the ten countries with the highest net migration of the first generation, Poland is one step ahead by a street length: 9,856 net first-generation immigrants, or more than a quarter of total immigration. Poland therefore has more net immigrants than the 47 Muslim countries combined. Places 7 to 10 are also occupied by EU countries. It is striking that these are countries of the former EU. Poland is the only country in Eastern Europe.
Somalia and Syria are the only two countries whose immigrants are mainly asylum seekers. They are also the only Muslim countries on the list. Among the four largest non-Western groups in our country (Morocco, the West Indies, Suriname and Turkey), we find the last three in the top 5 with a negative net migration. Turkey is number one. Net left 0.2% of the first generation. Morocco is absent from the table. We meet this country in Table 3:
I sorted this table according to the highest number of net departures of the second generation. Turkey is far ahead with 1,925 more emigrants than those returning. The big four occupy the top four places, which makes sense given their size, but Turkey really stands out with a net immigration of -1,925. This represents 1% of the population.


More Stories
How Old Are the Migrants? Also the Latest Migration Figures.
Once Again the Prankster of Mass Immigration
Why Do Foreigners Immigrate?